Getting Started
Welcome to Project Performance & Flow Analytics — a powerful Jira add-on that provides advanced metrics, deep performance insights, and analytics that Jira does not offer natively.
This guide will walk you through how to open the app, select an analysis period, interpret errors, and use the Issue History tool.
🚀 Accessing the App After Installation
Once the app is installed, it becomes available inside each Jira project.
In the new Jira interface, you can open it from the project’s top navigation bar:
Summary | Timeline | Board | Releases | More options
Go to:
More options → Project Performance & Flow Analytics
This will open the app.
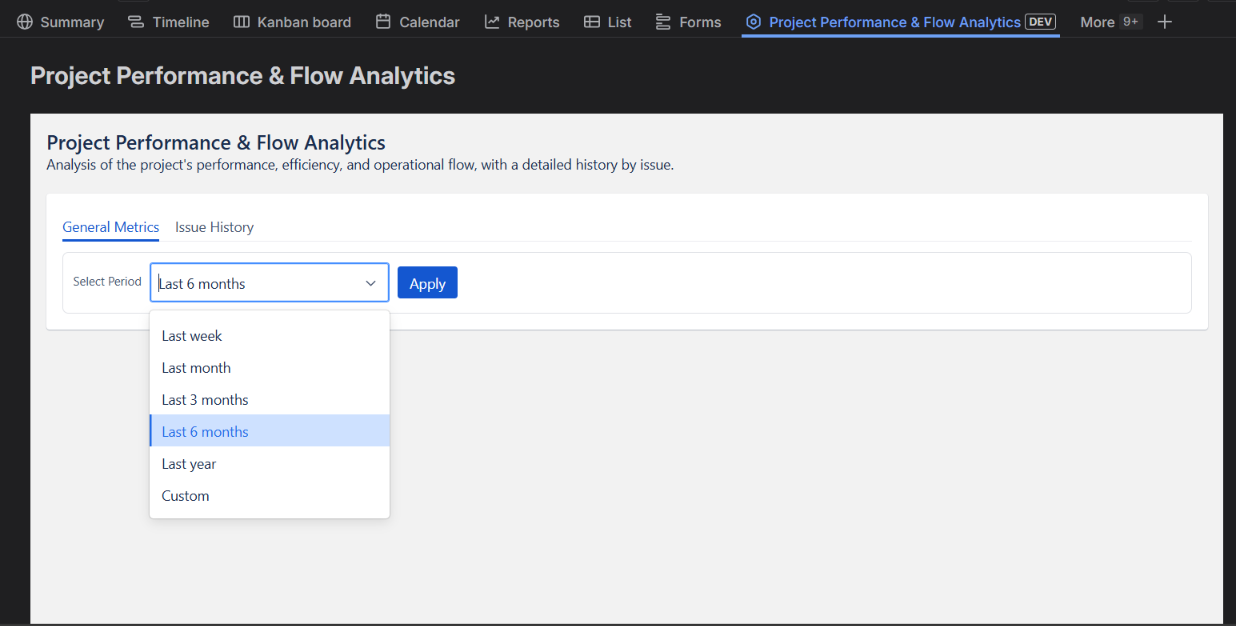
On first load, you will only see the Period Selector, which is required before generating analytics.
📅 Period Selection
The period selector is the first step in generating insights.
You can choose from several predefined ranges:
- Last week
- Last month
- Last 3 months
- Last 6 months (default)
- Last year
- Custom range

🛠️ Custom Date Range
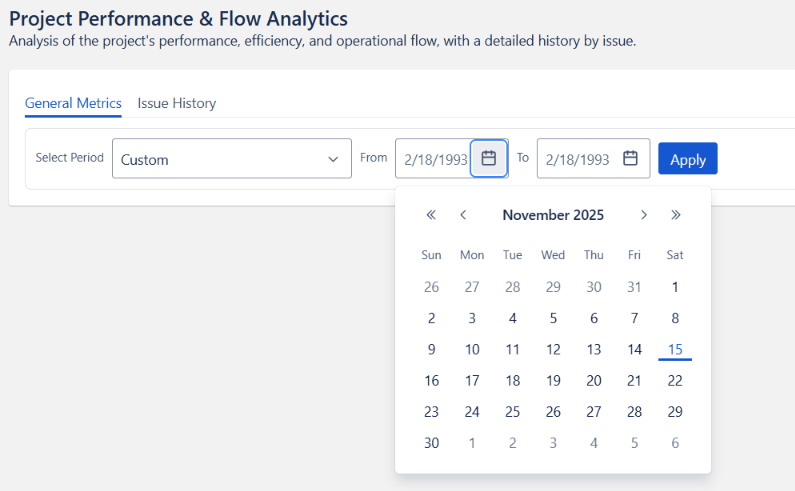
Selecting Custom will display two date pickers:
- From date
- To date
Important Limits
Maximum allowed range is 1 year
This limitation prevents slowdowns and avoids Jira REST API throttling.
Even if you choose dates from years such as 1999 or 2020, the total span must not exceed 12 months.
Best Practice
👉 Use short or medium ranges for the fastest analytics refresh.

▶️ Starting the Analysis
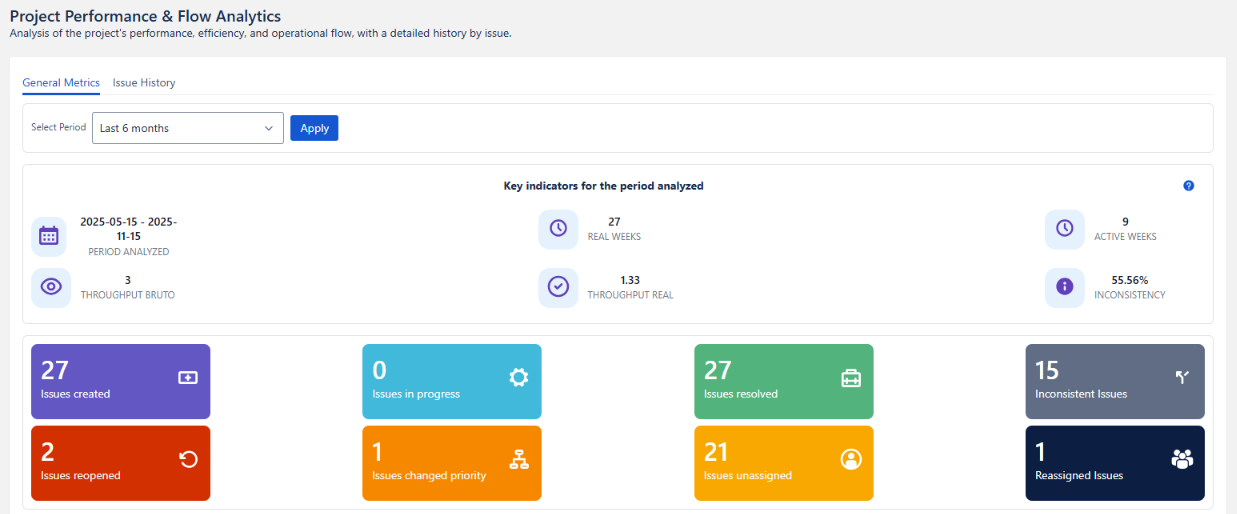
Once a valid period is selected, the app immediately begins:
- Fetching issue activity
- Aggregating metrics
- Calculating performance summaries
- Preparing graphs and tables
The dashboard loads automatically after processing.

🔍 Issue History Tool
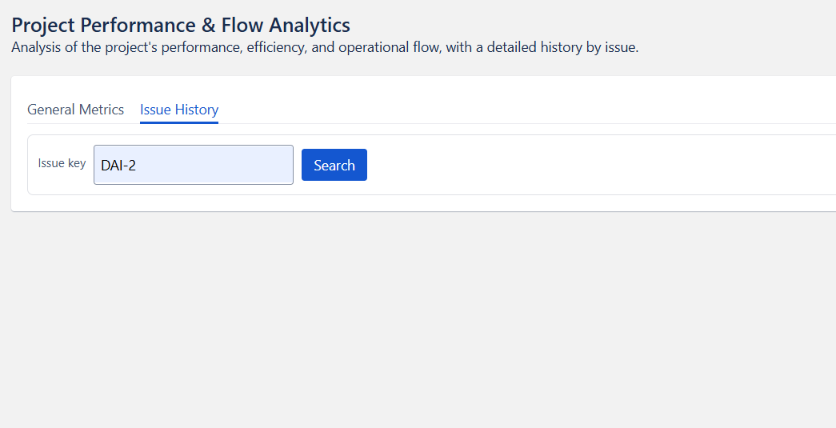
In the Issue history tab, you will find the Issue key input.
This section allows you to check the historical activity of a single issue, including:
- Status transitions
- Time spent
- Workload distribution
How to use it:
- Enter an issue key (e.g.,
PROJ-123) - Press Search
- View the complete lifecycle of the issue
- The issue must belong to the current project
- Issues from other projects cannot be retrieved

⚠️ Errors and Validation Messages
The app provides clear, friendly, and helpful error messages.
You may see an error if:
- ❌ The selected period returns no results
- ❌ The custom range exceeds 1 year
- ❌ The issue does not exist
- ❌ The issue belongs to another project
Example Error Messages
No data found for this period
Try selecting a shorter or more recent timeframe.
Custom period exceeds 1 year
Reduce the range to a maximum of 12 months.
Issue not found in this project
Verify the issue key and ensure it belongs to the current project.
💡 Helpful Tips
- Shorter analysis ranges load much faster
- Issue History is ideal for audits, post-mortems, QA reviews, and incident investigations
- The app requires no configuration — everything works out-of-the-box
- Metrics are aggregated using multiple Jira REST APIs into a single view
- All analytics are generated client-side to avoid exposing project data
🎉 You're Ready!
With the period selected and the dashboard loaded, you can now explore:
- Productivity metrics
- Flow efficiency
- Resolution quality
- Workload distribution
- Issue audit trails
Enjoy your new visibility into project performance!